Note: I decided that we needed a more explicit account of how Jockers visualized his 3346-node influence graph. I've inserted that account into the middle of the text and added subheadings.
I opened this investigation of Macroanalysis with the following paragraph:
The book arrived midway last week, when I hadn’t even finished reading Tim Morton’s Hyperobjects, much less finished blogging about it. But that didn’t stop me from giving Macroanalysis a look-thru: contents, some of the figures, read a bit here and there. I ended up reading Chapter 9, “Influence”, first; I’d read Matt Wilkins’ review in the LA Review of Books:It’s a nifty approach that produces a fascinatingly opaque result: Tristram Shandy, Laurence Sterne’s famously odd 18th-century bildungsroman, is judged to be the most influential member of the collection, followed by George Gissing’s unremarkable The Whirlpool (1897) and Benjamin Disraeli’s decidedly minor romance Venetia (1837). If you can make sense of this result, you’re ahead of Jockers himself, who more or less throws up his hands and ends both the chapter and the analytical portion of the book a paragraph later.Would I be able to make sense of those results? thought I to myself as I read. Nope, I couldn’t. Better luck next time.
I am now prepared to offer a re-interpretation of those results. But before I do that I need to explain more or less what Jockers is doing in this the final analytical chapter of the book. How does he operationalize the concept of influence?
What is influence?
When we say that, for example, that J. K. Rowling was influenced by the Narnia novels of C. S. Lewis, what do we mean? We mean that she read them and has incorporated features of those books into her own work. There is a direct relationship between Rowling’s activities and those influential books.
Influence thus understood is something that ‘travels’ along certain paths in the enormous meshwork of reading and writing transactions that constitute literary culture. As there are only a relatively few writers in that network, and only a relatively few of their transactions are writing ones (let’s say that the writing of a book is a single transaction) most of the transactions in the network are readings. Only a few of the transactions in the meshwork carry influence.
But Jockers doesn’t have access to that meshwork. None of us does. To be sure, we can see bits and pieces of it here in there in diaries, letters, and published reviews, but most of the transactions are lost to history. We can only look for the effects of those transactions.
And that’s what Jockers does. He assumes, reasonably enough, that if one author is influenced by another, then we should see indicators of that influence in the work. There should be a noticeable resemblance between those works.
And that is something Jockers can look for. For each of his 3,346 texts he’s got a bunch of features, stylistic and thematic. Once he’s tossed out the uninterpretable thematic features he’s left with 578 features for each text. He then represents this information as a geometric space with 578 dimensions, one for each feature, in which we have 3346 points, one for each text. He can now calculate the distance between any two texts, that is, points, in this high dimensional feature space. That distance is a measure of the similarity between the texts.
That’s what he does, and he gives us examples of the results. For each of Pride and Prejudice, Tale of Two Cities, and Moby Dick he gives us a table listing the ten novels the shortest distance from them and thus most like them (in terms of these 578 features). Not surprisingly, other books by Austen, Dickens, and Melville respectively occupy the top slots on these similarity lists. For the Austen list, the other authors are female, but one (Thomas Lister). Similarly, the authors most like Dickens are male, though the author of Life’s Masquerade (10th) is unknown, hence gender unknown. All the authors on these two lists are British. In Melville’s case, the list is also all-male, but not all-American. Two Scots, Robert Ballantyne and Robert Louis Stevenson, also made the list.
As interesting as this is, Jockers points out that it’s a bit small scale. We need something else if we want to gauge influence throughout the century. What to do?
Visualizing Similarity
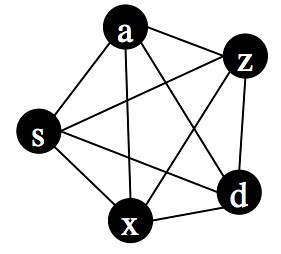
Why not put all the texts into a network representation (aka a graph) and track influence in the network? Easier said than done. Here is a simple graph (i.e. network):
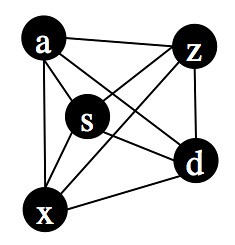
Each node can represent a text. Notice that each node is connected to every other node. What do those connections signify? In this case they are going to indicate similarity, but let’s set that aside for a moment. Instead, look at the following two graphs, each containing the same nodes but in a slightly different geometric arrangement:
Topologically, however, all three graphs are the same. They have the same nodes and the same pattern of connections between the nodes. The fact that they have different geometries is irrelevant.
However, when it comes to visualizing a graph, we have to impose some geometry on it in order to arrange the nodes and edges of a page. How do we choose that geometry? That depends on what the graph represents and what we’re looking for. In the case of Jockers’ graph, the nodes represent texts and the edges represent similarities between texts as measured in his 578 dimension ‘feature space.’ Obviously you would like similar texts to be close to one another in the geometry of the visualization. Further, the length of the edges between the nodes is calculated to be proportional to the degree of similarity between the nodes, and that places geometric constraints on the visualization.
But, Jockers has a graph consisting of 3346 nodes and 165,770 edges. Since the graph exists in a space of 578 dimensions the visualization has to be projected onto only two dimensions. Obviously, Jockers isn’t going to draw that graph by hand; he’s going to have a piece of software compute some appropriate geometry and render it on a surface.
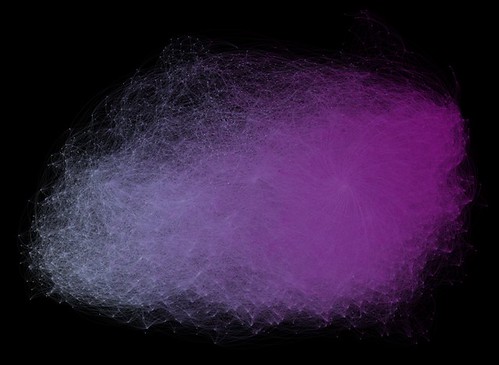
Here’s one such visualization, with the closest nodes being 0.06 units apart while the most distant are 107.4 units apart, with 10.5 being the average distance (p. 163). I’m skipping over a number of details (which you can find on pages 162-165), but the resulting graph looks like this (which is Figure 9.3, p. 165; color version from the web):
What’s remarkable about this graph is that the nodes are ordered in time from left (oldest) to right, but there is no temporal information in the data from which it was derived: “Books are being pulled together (and pushed apart) based on the similarity of their computed stylistic and thematic distances from each other” (p. 164). That temporal ordering is simply a side effect of ordering by thematic and stylistic similarity.
We need to think about that very carefully, because it’s very important. How did the computer come up with that visualization? Jockers was using a software package called Gephi and Gephi uses an algorithm called ForceAtlas2 for calculating the geometry of a visualization:
ForceAtlas2 is a force directed layout: it simulates a physical system in order to spatialize a network. Nodes repulse each other like charged particles, while edges attract their nodes, like springs. These forces create a movement that converges to a balanced state. This final configuration is expected to help the interpretation of the data. (Jacomy M, Venturini T, Heymann S, Bastian M (2014) ForceAtlas2, a Continuous Graph Layout Algorithm for Handy Network Visualization Designed for the Gephi Software. PLoS ONE 9(6): e98679. doi:10.1371/journal.pone.0098679.)
In effect, the network organizes its own geometry of visualization. And the geometry this network produced is one where the left-to-right ordering of texts by similarity is also very close to being an ordering by time.
The chronological alignment reveals that thematic and stylistic change does occur over time. The themes that writers employ and the high-frequency function words they use to build the frameworks for their themes are nearly, but not always, tethered in time. At this macro scale, style and theme are observed to evolve chronologically, and most books and authors in this network cluster into communities with their chronological peers. Not every book and not every author is a slave to his or her epoch.
Abstractly considered, it could have been otherwise. And in some cases it was. Jockers notes one case–Maria Edgworth’s Belinda in located in the network geometry with with books published two decades before it was (p. 167)–and presumably there are other cases. It’s might have been the case that there was no relationship between similarity and time, or that the relationship was much weaker than it happens to be. But no, it turns out that similarity in theme and style implies contiguity in time.
What kind of historical system operates like that?
Here’s the same graph colored by author gender (figure 9.4, p. 166, color version from the web):
Male authors are cyan, female authors magenta.
Jockers goes on to discuss some oddities about information these graphs, but I’m going to skip that, noting only that, as Jockers says, you need a large screen and interactive access to really explore patterns in the graph.
Is Similarity the Same Thing as Influence?
Let’s go to his final demonstration (pp. 167-168):
Node-centrality measures can provide a sense of a book’s importance to and within the larger network. The Gephi software provides tools for calculating these an many other measures, and through such measures Gephi gives us the power to sift and rank the relative importance of one node versus another....When applied to this nineteenth-century corpus in which the links are measures of stylistic and thematic affinity, the algorithm points us first to Laurence Sterne’s Tristram Shandy, next to George Gissing’s novel The Whirlpool, and then to Benjamin Disraeli’s Venetia. Tristram Shandy is a book frequently lauded as one of the highest achievements of the novel form, and, by all accounts, Gissing was one of the century’s most accomplished stylists. Disraeli’s minor novel Venetia is harder to understand. Maybe its presence here is a sign that the method had failed, or perhaps it is a sign that close readers need to reevaluate Venetia. In short, these network data are rich–too rich, in fact, to take much further in these pages because they demand that we follow every macroscale observation with a full-circle return to careful, sustained, close-reading. This is work for the future.
I agree, the data are rich, we need more and better ‘close’ reading, and there is much work for the future.
Before we do that, however, we need to prepare ourselves by thinking carefully about what Jockers has done and what his data show. For it is not clear to me that they demonstrate influence in a direct way. Our ordinary concept of influence implies reading: J. K. Rowling could have been influence by C. S. Lewis only because she had read his books before writing her own. But, as I pointed out earlier, Jockers’ data has no information about what these authors read. He’s using stylistic and thematic similarity as a proxy measure for who read whom.
That’s a reasonable thing to do given that similarity is one ‘natural’ result of influential reading (avoidance of conscious similarity is another, somewhat different, result, one that interests Harold Bloom). But, as the song says, it ain’t necessarily so. Consider the following diagram, which follows three traits (red, green, and blue) through three generations of texts:
Each text in the third generation exhibits all three traits. One text in the second generation exhibits the three traits while the other texts exhibit only two of them. The first generation texts exhibit only one trait each. (If you wish, you can imagine all of these texts as exhibiting other traits not shown in the diagram.)
The edges in the graph indicate where a given trait came from and so are about which texts were read by the authors of the second and third generation texts. Notice that none of the third generation texts got their traits from the lone second-generation text that exhibits all three traits. The authors of those three texts obviously did not read that second generation text. Yet, by Jockers’ similarity measure, it would show up as highly similar to those three texts.
What that implies is that it is possible that none of the authors who wrote the text most similar to Disraeli’s Venetia actually read the book. Rather, they may have adopted those traits from other books that they read. In this reading of the data, then, Disraeli’s book is a kind of least common denominator rather than an unheralded masterpiece.
Never having read it, I don’t really know, but I rather suspect that it’s not a masterpiece. Whether or not it was widely read and imitated, I don’t know and have no opinion. But, as the diagram indicates, that many subsequent books are like it doesn’t imply that the others of those books got those traits from having read Disraeli. Some of them may have done so, but that’s not a necessary implication of the data.
As for whether or not Jockers’ method failed in this case, well I suspect that it has. But that’s a lazy and unimaginative interpretation of what he’s done. That node centrality produced both an acknowledged masterpiece, Tristram Shandy, and a mediocrity, Venetia, in an assessment of overall stylistic and thematic similarity in a large corpus of 19th Century novels, that strikes me as something of extraordinary interest worthy of further investigation. I say Godspeed to all those scholars who are going to be looking more deeply, and more broadly, into these issues.
Finally, the fact that a graph of the corpus–3346 texts, remember–that is based on similarity information, that that graph should sort itself into temporal order implies that the literary system has strong internal dynamic coherence. It’s not going to be pushed hither and yon by external circumstances, though it does react to them. This bears Edward Said’s concern for the autonomy of the aesthetic sphere. No, the literary system is NOT isolated from the world; it is not autonomous in that utopian and uninteresting sense. Rather, we must understand the literary system as itself being a force in the world, one that has effects in and on the world.
* * * * *
Previously:
- Reading Macroanalysis 1: Framing: Hyperobjects, Objectification, and Evolution
- Reading Macroanalysis 2: Metadata and the Emperor’s New Clothes
- Reading Macroanalysis 2.1: How do we make inferences from patterns in collections of books to patterns in populations of readers?
- Reading Macroanalysis 3.0: Style, or the Author Comes Back from the Dead
- Reading Macroanalysis 3.1: Style, or Measuring the Autonomous Aesthetic Realm
- Reading Macroanalysis 4: On the matter of “the”
- Reading Macroanalysis 5: An Interlude on Scale: Micro, Meso, and Macro
- Reading Macroanalysis 6.1: Theme–Dogs, Gold, Slavery, and Awakening
- Reading Macroanalysis 6.2: Theme, Moby Dick in the Context of Literary Culture
- Reading Macroanalysis 6.3: DOGS and BIRDS, or, the hermeneutics of screwing around
- Reading Macroanalysis 6.4: Themes and how they evolve over time
- Reading Macroanalysis 7: Influence, or the evolving dynamic integrity of the aesthetic sphere
- Reading Macroanalysis 7.1: Visualizing the Geist of 19th Century Anglo-American Literary Culture
- Reading Macroanalysis 7.2: Hyperobjects and Large Finitude
- Reading Macroanalysis 7.3: Style, Genre, Time, and Influence


No comments:
Post a Comment