#BachUpsideDown #1: Here’s Bach’s 1st Goldberg Variation, normal, then upside down! Been meaning to do this for a while. My computer‘s doing a chromatic inversion of what I just played, so the intervals are preserved. You get incredible harmonic movement this way. Whoo! pic.twitter.com/8Ul9jNZjn8— Dan Tepfer (@tepferdan) May 31, 2019
Friday, May 31, 2019
Extreme counterpoint
Kids will sing and dance
why is this video of a sea of elementary school kids going HAM to old town road literally the funniest video i’ve ever seen in my whole life pic.twitter.com/iXItFq50QG— ari ❿ (@wasteIandbaby) May 30, 2019
Thursday, May 23, 2019

Farmers work harder than hunter-gathers
Farmers have less leisure time than hunter-gatherers, ScienceDaily, May 21, 2019
Hunter-gatherers in the Philippines who adopt farming work around ten hours a week longer than their forager neighbours, a new study suggests, complicating the idea that agriculture represents progress. The research also shows that a shift to agriculture impacts most on the lives of women.
For two years, a team including University of Cambridge anthropologist Dr Mark Dyble, lived with the Agta, a population of small scale hunter-gatherers from the northern Philippines who are increasingly engaging in agriculture.
Every day, at regular intervals between 6am and 6pm, the researchers recorded what their hosts were doing and by repeating this in ten different communities, they calculated how 359 people divided their time between leisure, childcare, domestic chores and out-of-camp work. While some Agta communities engage exclusively in hunting and gathering, others divide their time between foraging and rice farming.
The study, published today in Nature Human Behaviour, reveals that increased engagement in farming and other non-foraging work resulted in the Agta working harder and losing leisure time. On average, the team estimate that Agta engaged primarily in farming work around 30 hours per week while foragers only do so for 20 hours. They found that this dramatic difference was largely due to women being drawn away from domestic activities to working in the fields. The study found that women living in the communities most involved in farming had half as much leisure time as those in communities which only foraged.
Wednesday, May 22, 2019
The statistical mechanics of musical harmony
Jesse Berezovsky, The structure of musical harmony as an ordered phase of sound: A statistical mechanics approach to music theory, Science Advances 17 May 2019: Vol. 5, no. 5, eaav8490 DOI: 10.1126/sciadv.aav8490
Abstract
Music, while allowing nearly unlimited creative expression, almost always conforms to a set of rigid rules at a fundamental level. The description and study of these rules, and the ordered structures that arise from them, is the basis of the field of music theory. Here, I present a theoretical formalism that aims to explain why basic ordered patterns emerge in music, using the same statistical mechanics framework that describes emergent order across phase transitions in physical systems. I first apply the mean field approximation to demonstrate that phase transitions occur in this model from disordered sound to discrete sets of pitches, including the 12-fold octave division used in Western music. Beyond the mean field model, I use numerical simulation to uncover emergent structures of musical harmony. These results provide a new lens through which to view the fundamental structures of music and to discover new musical ideas to explore.
Introduction
The ubiquity of music throughout history and across cultures raises a fundamental question: Why is this way of arranging sounds such a powerful medium for human artistic expression? Although there are myriad musical systems and styles, certain characteristics are nearly universal, including emergent symmetries such as a restriction to a discrete set of sound frequencies (pitches). Historically, the theory of music has followed an empirical top-down approach: Patterns are observed in music and generalized into theories. Recent work has aimed to generalize these generalized theories to uncover new potential patterns that can lead to new theories of music (1–3). Here, instead, we observe patterns that emerge naturally from a bottom-up theory. We start from two basic (and conflicting) principles: A system of music is most effective when it (i) minimizes dissonant sounds and (ii) allows sufficient complexity to allow the desired artistic expression. Mathematical statement of these principles allows a direct mapping onto a standard statistical mechanics framework. We can thereby apply the tools of statistical mechanics to explore the phenomena that emerge from this model of music. Just as in physical systems where ordered phases with lower symmetry (e.g., crystals) emerge across transitions from higher-symmetry disordered phases (e.g., liquids), we observe ordered phases of music self-organizing from disordered sound. These ordered phases can replicate elements of traditional Western and non-Western systems of music, as well as suggesting new directions to be explored.
The basis for a bottom-up approach was provided by discoveries in the field of psychoacoustics originating with Helmholtz (4) and further developed in the 20th century, which established a quantitative understanding of how sound is perceived. This leads to the idea that the structure of music is related to a minimization of dissonance D, as explored by Plomp and Levelt (5), Sethares (6, 7), and others. Minimization of D cannot be the only criterion for an effective musical system, however, or we would all listen to “music” composed from just a single pitch. Instead, an effective system of music must have some degree of complexity to provide a sufficiently rich palette from which to compose. A recognition of this idea has led to work on quantifying complexity in music, including by computing the entropy S of music in the context of information theory (8) or by considering musical systems to be self-organizing via an evolutionary process (9).
The model I present here combines both the minimization of D and the maximization of S. I draw an analogy to thermodynamic systems with energy U and entropy S, whose macrostate is determined by minimizing Helmholtz free energy F = U − TS. The fixed temperature T is a parameter that specifies the trade-off between decreasing U and increasing S. Here, I similarly introduce a parameter T that specifies the trade-off between decreasing D and increasing S. A musical system in equilibrium will then be found by minimizing F = D − TS, allowing us to exploit the powerful array of tools developed for studying physical systems in statistical mechanics.
The remainder of this paper is organized as follows: I next describe the general model presented here, including how dissonance is quantified. Then, we study the behavior of the model in the mean field approximation and observe phase transitions between disordered sound and ordered distributions of pitches that reproduce commonly used musical systems. Last, we turn to a more realistic model with fewer assumptions and use numerical simulation to explore the patterns that emerge on a lattice of interacting tones.
Tuesday, May 21, 2019
Kinda' Cool: Miles Davis Meets Mr. Rogers
Dang, I never knew that Miles Davis was a guest on Mister Rogers’ Neighborhood. pic.twitter.com/yJDSeUYIzR— Ted Gioia (@tedgioia) May 21, 2019
Monday, May 20, 2019

Sunday, May 19, 2019
"Foxes" are better at predicting the future than "hedgehogs"
David Epstein, The Peculiar Blindness of Experts, The Atlantic, June 2019:
One subgroup of scholars, however, did manage to see more of what was coming. Unlike Ehrlich and Simon, they were not vested in a single discipline. They took from each argument and integrated apparently contradictory worldviews. They agreed that Gorbachev was a real reformer and that the Soviet Union had lost legitimacy outside Russia. A few of those integrators saw that the end of the Soviet Union was close at hand and that real reforms would be the catalyst.
The integrators outperformed their colleagues in pretty much every way, but especially trounced them on long-term predictions. Eventually, Tetlock bestowed nicknames (borrowed from the philosopher Isaiah Berlin) on the experts he’d observed: The highly specialized hedgehogs knew “one big thing,” while the integrator foxes knew “many little things.”
Hedgehogs are deeply and tightly focused. Some have spent their career studying one problem. Like Ehrlich and Simon, they fashion tidy theories of how the world works based on observations through the single lens of their specialty. Foxes, meanwhile, “draw from an eclectic array of traditions, and accept ambiguity and contradiction,” Tetlock wrote. Where hedgehogs represent narrowness, foxes embody breadth.
Incredibly, the hedgehogs performed especially poorly on long-term predictions within their specialty. They got worse as they accumulated experience and credentials in their field. The more information they had to work with, the more easily they could fit any story into their worldview. [...]
In Tetlock’s 20-year study, both the broad foxes and the narrow hedgehogs were quick to let a successful prediction reinforce their beliefs. But when an outcome took them by surprise, foxes were much more likely to adjust their ideas. Hedgehogs barely budged. Some made authoritative predictions that turned out to be wildly wrong—then updated their theories in the wrong direction. They became even more convinced of the original beliefs that had led them astray. The best forecasters, by contrast, view their own ideas as hypotheses in need of testing. If they make a bet and lose, they embrace the logic of a loss just as they would the reinforcement of a win. This is called, in a word, learning.

Ridding Facebook of "bad activity" – AI isn't up to the task
Cade Metz and Mike Isaac, Facebook’s A.I. Whiz Now Faces the Task of Cleaning It Up. Sometimes That Brings Him to Tears. NYTimes, 17 May 2019.
Mr. Schroepfer — or Schrep, as he is known internally — is the person at Facebook leading the efforts to build the automated tools to sort through and erase the millions of such posts. But the task is Sisyphean, he acknowledged over the course of three interviews recently.That’s because every time Mr. Schroepfer and his more than 150 engineering specialists create A.I. solutions that flag and squelch noxious material, new and dubious posts that the A.I. systems have never seen before pop up — and are thus not caught. The task is made more difficult because “bad activity” is often in the eye of the beholder and humans, let alone machines, cannot agree on what that is.In one interview, Mr. Schroepfer acknowledged after some prodding that A.I. alone could not cure Facebook’s ills. “I do think there’s an endgame here,” he said. But “I don’t think it’s ‘everything’s solved,’ and we all pack up and go home.”
Dealing with images (e.g. nudity) is one thing. Words are more difficult:
Identifying rogue images is also one of the easier tasks for A.I. It is harder to build systems to identify false news stories or hate speech. False news stories can easily be fashioned to appear real. And hate speech is problematic because it is so difficult for machines to recognize linguistic nuances. Many nuances differ from language to language, while context around conversations rapidly evolves as they occur, making it difficult for the machines to keep up.Delip Rao, head of research at A.I. Foundation, a nonprofit that explores how artificial intelligence can fight disinformation, described the challenge as “an arms race.” A.I. is built from what has come before. But so often, there is nothing to learn from. Behavior changes. Attackers create new techniques. By definition, it becomes a game of cat and mouse.
“Sometimes you are ahead of the people causing harm,” Mr. Rao said. “Sometimes they are ahead of you.”On that afternoon, Mr. Schroepfer tried to answer our questions about the cat-and-mouse game with data and numbers. He said Facebook now automatically removed 96 percent of all nudity from the social network. Hate speech was tougher, he said — the company catches 51 percent of that on the site. (Facebook later said this had risen to 65 percent.)
In Praise of Women’s Hands
Once more I'm bumping this (originally from July 2014) to the top of the queue, this time to complement a NYTimes article on the math and physics of knitting.
I'm bumping this to the top of the queue in light of recent ghastly, but not, alas, terribly surprising, stories about the unconscionable behavior of Harvey Weinstein, Leon Wiesletier, and other powerful men – let's not forget 45!, nor Bill Clinton, JFK, and on and on and on. But, you know, Queen Elizabeth I knew the score, Nina Paley too.
* * * * *
Bless in a congregation, because they are so numerous, those industrious schoolgirls, stitching their alphabets; and the deft ones, with needles at lacework, crewel, knitting; and mistresses of spinning, weaving, dyeing; and daughters of tinsmiths painting their ornamental mottoes; and hoarders of rags hooking and braiding their rugs; and adepts in cutouts, valentines, stencils, still lifes, and "fancy pieces"; and middle-aged housewives painting, for the joy of it, landscapes and portraits; and makers of bedcovers with names that sing in the night – Rose of Sharon, Princess Feather, Delectable Mountains, Turkey Tracks, Drunkard's Path, Indiana Puzzle, Broken Dishes, Star of Lemoyne, Currants and Coxcomb, Rocky-Road-to Kansas.
Bless them and greet them as they pass from their long obscurity, through the gate that separates us from our history, a moving rainbow-cloud of witnesses in a rising hubbub, jubilantly turning to greet one another, this tumult of sisters.
—Stanley Kunitz, A Blessing of Women
We all know that the hand that rocks the cradle rules the world. We also know that’s nonsense, pious and sentimental nonsense. Which is why it has been said so often.
The subtext, of course, is that the cradle-rocking hand is connected, through appropriate anatomical intermediaries, to a foot that’s chained to the dishwasher, the oven, the vacuum cleaner, and the sewing machine.
I would like to praise that cradle-rocking hand, even, in a sense, in its cradle-rocking mode. This cradle-rocking hand, we are told, is better at delicate manual tasks – I learned that as a child – than are men’s hands, the hands that shoot the guns, pilot the ship of state, and keep charge of the shackles connecting that associated foot to those many domestic appliances. That’s what I’m interested in, this hand with its delicate and versatile ability to make things, to make a world.
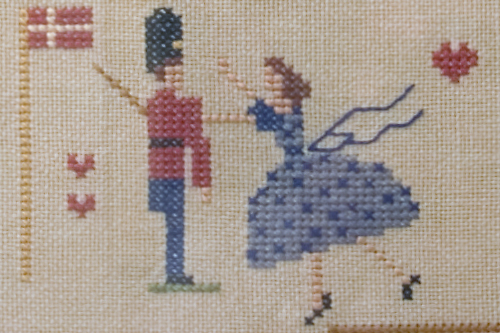
A Sampler
Here’s an example that I grew up with:
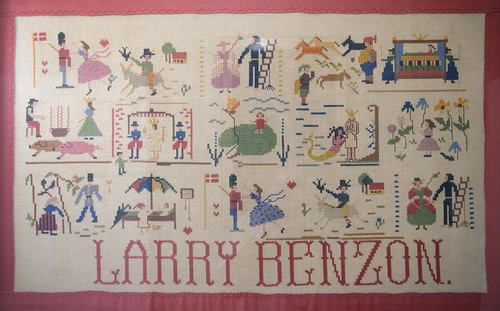
It’s a sampler illustrating scenes from fairy tales by Hans Christian Anderson. It was done by a woman I never met, a great aunt who, I believe, was named Agnete. She was Danish, as were my paternal grandparents.
Such sewing skills – in this case, needlepoint embroidery – were routine for women of her generation, born in the 19th Century, and the making of a sampler was often a rite of passage for a young girl. My mother was born in the early 20th Century, when women were also expected to be able to sew well. I can still hear the sound of her sewing machine and remember how I marveled at her skilled hands moving cloth beneath the needle. She also embroidered in both needlepoint and crewel styles.

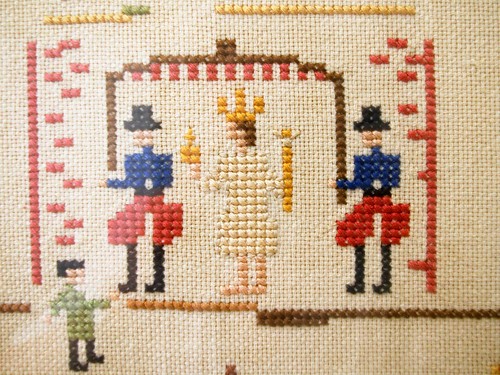 |
| Close-ups from Aunt Agnete's sampler. |
Such needlework was done in the home for family, though some women also did piecework for money.
On the physics, mathematics, and algorithms of knitting – What's floofy?
Siobhan Roberts, ‘Knitting Is Coding’ and Yarn Is Programmable in This Physics Lab, NYTimes, May 17, 2019.
Dr. Elisabetta Matsumoto, a physicist at Georgia Tech, "is embarking on a five-year project, 'What a Tangled Web We Weave,' funded by the National Science Foundation, to investigate the mathematics and mechanics of 'the ancient technology known as knitting.'"
The investigation is informed by the mathematical tradition of knot theory. A knot is a tangled circle — a circle embedded with crossings that cannot be untangled. (A circle with no crossings is an “unknot.”)“The knitted stitch is a whole series of slipknots, one after the other,” said Dr. Matsumoto. Rows and columns of slipknots form a lattice pattern so regular that it is analogous to crystal structure and crystalline materials.By way of knot theory, Dr. Matsumoto essentially is developing a knit theory: an alphabet of unit-cell stitches, a glossary of stitch combinations, and a grammar governing the knitted geometry and topology — the fabric’s stretchiness, or its “emergent elasticity.” [...]For the Tangled Web project, most of the experimental knitting is produced by a replica of a vintage 1970s knitting machine, the Taitexma Industrial and Home-Based Knitting Machine Model TH-860, which is operated by Krishma Singal, a doctoral student. The machine can also be programmed by punched cards — as was the Jacquard loom, invented in 1804 by Joseph Marie Jacquard and sometimes called the first digital technology.Dr. Matsumoto’s team likes to contemplate how stitch patterns provide code — more complex code than the 1s and 0s of binary — that creates the program for the elasticity and geometry of knitted fabric. The buzzword is “topological programmable materials,” said postdoc Michael Dimitriyev.He is working on a computer simulation of knitted fabric, inputting yarn properties and stitch topology, and outputting the geometry and elasticity of the real-life finished object. “I’m the killjoy that brings in elasticity,” he likes to say.The team’s first paper, currently underway, will verify Dr. Dimitriyev’s simulations against Ms. Singal’s hard-copy swatches. Once the computer simulation is refined, Dr. Matsumoto and her collaborators can pull out equations and algorithms for knitted fabric behavior, which in turn could be put into physics engines for computer game graphics, or movies.Pixar’s “Brave” and “Monsters, Inc.” showcased cutting-edge animation of hair and fur, but yarn has yet to have its time in the spotlight. Fabric animation is still very trial-and-error, and it requires time-intensive supercomputers to render.
Saturday, May 18, 2019


The 'Nordic paradox'–Gender equality seems correlated with a high incidence of intimate partner violence against women (IPVAW)
Gracia E, Martín-Fernández M, Lila M, Merlo J, Ivert A-K (2019) Prevalence of intimate partner violence against women in Sweden and Spain: A psychometric study of the ‘Nordic paradox’. PLoS ONE 14(5): e0217015. https://doi.org/10.1371/journal.pone.0217015
Abstract
The high prevalence of intimate partner violence against women (IPVAW) in countries with high levels of gender equality has been defined as the “Nordic paradox”. In this study we compared physical and sexual IPVAW prevalence data in two countries exemplifying the Nordic paradox: Sweden (N = 1483) and Spain (N = 1447). Data was drawn from the European Union Agency for Fundamental Rights Survey on violence against women. To ascertain whether differences between these two countries reflect true differences in IPVAW prevalence, and to rule out the possibility of measurement bias, we conducted a set of analyses to ensure measurement equivalence, a precondition for appropriate and valid cross-cultural comparisons. Results showed that in both countries items were measuring two separate constructs, physical and sexual IPVAW, and that these factors had high internal consistency and adequate validity. Measurement equivalence analyses (i.e., differential item functioning, and multigroup confirmatory factor analysis) supported the comparability of data across countries. Latent means comparisons between the Spanish and the Swedish samples showed that scores on both the physical and sexual IPVAW factors were significantly higher in Sweden than in Spain. The effect sizes of these differences were large: 89.1% of the Swedish sample had higher values in the physical IPVAW factor than the Spanish average, and this percentage was 99.4% for the sexual IPVAW factor as compared to the Spanish average. In terms of probability of superiority, there was an 80.7% and 96.1% probability that a Swedish woman would score higher than a Spanish woman in the physical and the sexual IPVAW factors, respectively. Our results showed that the higher prevalence of physical and sexual IPVAW in Sweden than in Spain reflects actual differences and are not the result of measurement bias, supporting the idea of the Nordic paradox.
Introduction
Intimate partner violence against women (IPVAW) remains a pervasive social and public health problem in western societies [1–8]. Increasing gender equality is at the core of the prevention efforts of this type of violence, as gender inequality is considered a main factor explaining IPVAW. Accordingly, rates of IPVAW are expected to drop as country-level gender equality increases [9–12] (see [13] for a review). However, in western countries, high country levels of gender equality are not always linked with low prevalence of IPVAW.
The high prevalence of IPVAW in countries with high levels of gender equality was defined by Gracia and Merlo as the “Nordic paradox” [14]. Nordic countries are, according to different international indicators (e.g., Global Inequality Index; Global Gender Gap Index; European Index of Gender Equality), the most gender equal countries in the world [15–17]. However, despite these high levels of gender equality, Nordic countries have high prevalence rates of IPVAW. The high prevalence of IPVAW in Nordic countries is illustrated by a European Union (EU) survey on violence against women conducted by the European Union Agency for Fundamental Rights (FRA) [18]. In this survey the average lifetime prevalence of physical and/or sexual violence by intimate partners in the 28 EU member states was 23%, with a range between 13% and 32%. However, Nordic countries in the EU were among the countries with higher lifetime prevalence of IPVAW, with rates of 32% (Denmark, the highest IPV prevalence in the EU), 30% (Finland), and 28% (Sweden). The high prevalence of IPVAW in Nordic countries is also supported by other studies and national surveys [19–25]. However, despite survey and research data pointing to a disproportionally high level of IPVAW in countries with the highest levels of gender equality like the Nordic ones, interestingly, this puzzling research question is rarely asked and, so far, remains unanswered.
The reasons explaining these high levels of IPVAW prevalence in Nordic countries, despite their high levels of gender equality, are not yet understood as almost no research has addressed specifically this paradox [22]. Gracia and Merlo [14], proposed a number of theoretical and methodological lines of inquiry towards understanding the Nordic paradox. However, as these authors noted [14], a first step to ascertain whether the Nordic paradox reflects true differences in IPVAW prevalence is to rule out the possibility that measurement bias is causing prevalence differences between Nordic and other countries. To eliminate this possibility, a key question is to ensure the comparability of IPVAW prevalence data across countries. In other words, comparisons of IPVAW data across countries should not be made without first ensuring measurement invariance.
IPVAW can be a culturally sensitive issue, and the way this type of violence is perceived or reported may vary across countries. Therefore, ensuring cross-cultural measurement invariance is critically important for appropriate and valid cross-cultural comparisons of self-reported IPVAW scores between respondents from different countries [26–32]. As Jang et al. noted [29], different perceptions of items or different interpretations of response scales can lead to measurement non-invariance (i.e., non-equivalence of measures). If this is the case, it cannot be assumed that the construct of interest, in our case IPVAW, is interpreted in the same way across countries because the same score in one country may have a different meaning or reflect different levels of IPVAW in another. Without ensuring measurement invariance, score comparisons across samples from different countries can be unreliable and inadequate, and the validity of comparing women’s IPVAW experiences across countries becomes questionable [28,29,32,33].
Tuesday, May 14, 2019
A note about Bell Labs
Ashutosh Jogalekar, Life and Death in New Jersey, 3 Quarks Daily, May 14, 2019:
Bell Labs was the most productive research laboratory in the world for almost five decades. A “Member of Technical Staff” title there was probably the most prestigious professional job title anywhere. As Jon Gertner so ably describes in his biography of the laboratory, “The Idea Factory”, not only did the lab invent revolutionary commercial products like the transistor and satellite communications that completely transformed our way of life, but it also produced a dozen Nobel Laureates like Penzias and Wilson who completely transformed our view of the cosmos. As if to drive home the stunning fall of this giant of American science and technology, the sign in front of the modest, gray building bids you farewell – “Nokia Bell Labs”. Fifty years from now, would we see that beautiful little hill as the hill on which American innovation chose to die? Bell Labs was the most productive research laboratory in the world for almost five decades. A “Member of Technical Staff” title there was probably the most prestigious professional job title anywhere. As Jon Gertner so ably describes in his biography of the laboratory, “The Idea Factory”, not only did the lab invent revolutionary commercial products like the transistor and satellite communications that completely transformed our way of life, but it also produced a dozen Nobel Laureates like Penzias and Wilson who completely transformed our view of the cosmos. As if to drive home the stunning fall of this giant of American science and technology, the sign in front of the modest, gray building bids you farewell – “Nokia Bell Labs”. Fifty years from now, would we see that beautiful little hill as the hill on which American innovation chose to die?
Geoffrey Hinton (neural network pioneer) interview
AI Pioneer @geoffreyhinton Explains the Evolution of Neural Networks, in this fascinating interview w @nxthompson https://t.co/LybmRZjNzp— Steven Strogatz (@stevenstrogatz) May 14, 2019
From the interview:
Geoffrey Hinton: One of the big disappointments in the ’80’s was, if you made networks with lots of hidden layers, you couldn't train them. That's not quite true, because you could train for fairly simple tasks like recognizing handwriting. But most of the deep neural nets, we didn't know how to train them. And in about 2005, I came up with a way of doing unsupervised training of deep nets. So you take your input, say your pixels, and you'd learn a bunch of feature detectors that were just good at explaining why the pixels were even like that. And then you treat those feature detectors as the data, and you learn another bunch of feature detectors, so we could explain why those feature detectors have those correlations. And you keep learning layers and layers. But what was interesting was, you could do some math and prove that each time you learned another layer, you didn't necessarily have a better model of the data, but you had a band on how good your model was. And you could get a better band each time you added another layer.
Nicholas Thompson: What do you mean, you had a band on how good your model was?
GH: Once you've got a model, you can say, “How surprising does a model find this data?” You show it some data and you say, “Is that the kind of thing you believe in, or is that surprising?” And you can sort of measure something that says that. And what you'd like to do is have a model, a good model is one that looks at the data and says, “Yeah, yeah, I knew that. It's unsurprising.” It's often very hard to compute exactly how surprising this model finds the data. But you can compute a band on that. You can say that this model finds the data less surprising than that one. And you could show that as you add extra layers of feature detectors, you get a model, and each time you add a layer, the band on how surprising it finds the data gets better. [...]
NT: Well, what distinguishes the areas where it works the most quickly and the areas where it will take more time? It seems like visual processing, speech recognition, sort of core human things that we do with our sensory perception are deemed to be the first barriers to clear, is that correct?
GH: Yes and no, because there are other things we do like motor control. We're very good at motor control. Our brains are clearly designed for that. And only just now are neural nets beginning to compete with the best other technologies that’s there. They will win in the end, but they're only just winning now.
I think things like reasoning, abstract reasoning, they’re the kind of last things we learn to do, and I think they'll be among the last things these neural nets learn to do. [...]
NT: And then there's a separate problem, which is, we don't know entirely how these things work, right?
GH: No, we really don't know how they work.
NT: We don't understand how top-down neural networks work. That’s a core element of how neural networks work that we don't understand. Explain that, and then let me ask the obvious follow up, which is, if we don't know how these things work, how can those things work?
GH: If you look at current computer vision systems, most of them basically feed forward; they don't use feedback connections. There's something else about current computer vision systems, which is they're very prone to adversarial errors. You can change a few pixels slightly, and something that was a picture of a panda and still looks exactly like a panda to you, it suddenly says that’s an ostrich. Obviously, the way you change the pixels is cleverly designed to fool it into thinking it's an ostrich. But the point is, it still looks like a panda to you.
Initially we thought these things worked really well. But then, when confronted with the fact that they're looking at a panda and are confident it’s an ostrich, you get a bit worried. I think part of the problem there is that they're not trying to reconstruct from the high-level representations. They're trying to do discriminative learning, where you just learn layers of feature detectors, and the whole objective is just to change the weights so you get better at getting the right answer. And recently in Toronto, we've been discovering, or Nick Frost has been discovering, that if you introduce reconstruction, then it helps you be more resistant to adversarial attack. So I think in human vision, to do the learning, we're doing reconstruction. And also because we're doing a lot of learning by doing reconstructions, we are much more resistant to adversarial attacks. [...]
NT: True, fair enough. So what are we learning about the brain from our work in computers?
GH: So I think what we've learned in the last 10 years is that if you take a system with billions of parameters, and an objective function—like to fill in the gap in a string of words—it works much better than it has any right to. It works much better than you would expect. You would have thought, and most people in conventional AI thought, take a system with a billion parameters, start them off with random values, measure the gradient of the objective function—that is for each parameter, figure out how the objective function would change if you change that parameter a little bit—and then change it in the direction that improves the objective function. You would have thought that would be a kind of hopeless algorithm that gets stuck. But it turns out, it's a really good algorithm. And the bigger you scale things, the better it works. And that's just an empirical discovery, really. There's some theory coming along, but it's basically an empirical discovery. Now, because we've discovered that, it makes it far more plausible that the brain is computing the gradient of some objective function, and updating the weights of strength of synapses to follow that gradient. We just have to figure out how it gets degraded and what the objective function is.
One idea about dreaming (of 4):
GH: So a long time ago, there were things called Hopfield networks, and they would learn memories as local attractors. And Hopfield discovered that if you try and put too many memories in, they get confused. They'll take two local attractors and merge them into an attractor sort of halfway in between.
Then Francis Crick and Graeme Mitchison came along and said, we can get rid of these false minima by doing unlearning. So we turn off the input, we put the neural network into a random state, we let it settle down, and we say that's bad, change the connection so you don't settle to that state, and if you do a bit of that, it will be able to store more memories.
And then Terry Sejnowski and I came along and said, “Look, if we have not just the neurons where you’re storing the memories, but lots of other neurons too, can we find an algorithm that will use all these other neurons to help restore memories?” And it turned out in the end, we came up with the Boltzmann machine-learning algorithm, which had a very interesting property: I show you data, and it sort of rattles around the other units until it's got a fairly happy state, and once it's done that, it increases the strength of all the connections based on if two units are both active.
You also have to have a phase where you cut it off from the input, you let it rattle around and settle into a state it’s happy with, so now it's having a fantasy, and once it’s had the fantasy you say, “Take all pairs of neurons that are active and decrease the strength of the connection.”
So I'm explaining the algorithm to you just as a procedure. But actually, that algorithm is the result of doing some math and saying, “How should you change these connection strings, so that this neural network with all these hidden units finds the data unsurprising?” And it has to have this other phase, what we call the negative phase, when it's running with no input, and its unlearning whatever state it settles into.
We dream for many hours every night. And if I wake you up at random, you can tell me what you were just dreaming about because it’s in your short-term memory. So we know you dream for many hours, but when you wake up in the morning, you can remember the last dream but you can't remember all the others—which is lucky, because you might mistake them for reality. So why is it we don't remember our dreams at all? And Crick’s view was, the whole point of dreaming is to unlearn those things. So you put the learning all in reverse.
And Terry Sejnowski and I showed that, actually, that is a maximum-likelihood learning procedure for Boltzmann machines. So that's one theory of dreaming.
Monday, May 13, 2019
Why not drum circles in PE class?
The new thing in school PE class: drum circles. https://t.co/5SyvLU8cus— Ted Gioia (@tedgioia) May 13, 2019
Friday, May 10, 2019

The underside of the "Green New Deal" – among other things, the mining of nonrenewable minerals
Jasper Bernes, Between the Devil and the Green New Deal, Commune, Spring 2019:
To meet the demands of the Green New Deal, which proposes to convert the US economy to zero emissions, renewable power by 2030, there will be a lot more of these mines gouged into the crust of the earth. That’s because nearly every renewable energy source depends upon non-renewable and frequently hard-to-access minerals: solar panels use indium, turbines use neodymium, batteries use lithium, and all require kilotons of steel, tin, silver, and copper. The renewable-energy supply chain is a complicated hopscotch around the periodic table and around the world. To make a high-capacity solar panel, one might need copper (atomic number 29) from Chile, indium (49) from Australia, gallium (31) from China, and selenium (34) from Germany. Many of the most efficient, direct-drive wind turbines require a couple pounds of the rare-earth metal neodymium, and there’s 140 pounds of lithium in each Tesla. [...]Is it just another attempt to preserve capitalism? Is it capitalism that is the problem? And beyond capitalism?
It’s not clear we can even get enough of this stuff out of the ground, however, given the timeframe. Zero-emissions 2030 would mean mines producing now, not in five or ten years. The race to bring new supply online is likely to be ugly, in more ways than one, as slipshod producers scramble to cash in on the price bonanza, cutting every corner and setting up mines that are dangerous, unhealthy, and not particularly green. Mines require a massive outlay of investment up front, and they typically feature low return on investment, except during the sort of commodity boom we can expect a Green New Deal to produce. It can be a decade or more before the sources are developed, and another decade before they turn a profit.
The problem with the Green New Deal is that it promises to change everything while keeping everything the same. It promises to switch out the energetic basis of modern society as if one were changing the battery in a car. You still buy a new iPhone every two years, but zero emissions. The world of the Green New Deal is this world but better—this world but with zero emissions, universal health care, and free college. The appeal is obvious but the combination impossible. We can’t remain in this world. To preserve the ecological niche in which we and our cohort of species have lived for the last eleven thousand years, we will have to completely reorganize society, changing where and how and most importantly why we live. Given current technology, there is no possibility to continue using more energy per person, more land per person, more more per person. This need not mean a gray world of grim austerity, though that’s what’s coming if inequality and dispossession continue. An emancipated society, in which no one can force another into work for reasons of property, could offer joy, meaning, freedom, satisfaction, and even a sort of abundance. We can easily have enough of what matters—conserving energy and other resources for food, shelter, and medicine. As is obvious to anyone who spends a good thirty seconds really looking, half of what surrounds us in capitalism is needless waste. Beyond our foundational needs, the most important abundance is an abundance of time, and time is, thankfully, carbon-zero, and even perhaps carbon-negative. If revolutionaries in societies that used one-fourth as much energy as we do thought communism right around the corner, then there’s no need to shackle ourselves to the gruesome imperatives of growth. A society in which everyone is free to pursue learning, play, sport, amusement, companionship, and travel, in this we see the abundance that matters.
H/t Tyler Cowen.
Prestige is more important than merit in academic hiring
Eva-Maria Swidler, A Modest(y) Proposal, from the AAUP:
An article detailing some stark facts about social inequality within academia made a small blip in higher education three years ago. According to Aaron Clauset, Samuel Arbesman, and Daniel B. Larremore in their February 2015 Science Advances article, “Systematic Inequality and Hierarchy in Faculty Hiring Networks,” prestige has come to predominate strikingly over merit as the primary consideration in the selection of tenured and tenure-track professors. Examining three disciplines, the authors found that “faculty hiring follows a common and steeply hierarchical structure that reflects profound social inequality,” showing a strong preference—unaccounted for by any measure of merit—for appointing faculty members with degrees from prestigious universities. They reported that in my own discipline of history, more than half of all tenured or tenure-track professors in 144 surveyed institutions had received their PhDs from only eight institutions. The authors also pointed out that the greater the importance of non-meritocratic factors in hiring, the weaker the correlation between prestige and merit. In other words, the prestige of the university where you received your PhD has replaced consideration of your actual qualification or worthiness as defined by knowledge, wisdom, skill, or work. In Sarah Kendzior’s words in her 2015 ChronicleVitae piece “Academia’s 1 Percent,” “The fate of aspiring professors is sealed not with job applications but with graduate-school applications. Institutional affiliation has come to function like inherited wealth.”
Who benefits from driverless cars (not the poor)
Ashley Nunes, Driverless cars: researchers have made a wrong turn, Nature, 8 May 2019:
By merely rehashing the talking points of the self-driving industry, well-meaning academics draw attention away from the most important question that we should be asking about this technology: who stands to gain from its life-saving potential? Sam Harper, an epidemiologist at McGill University in Montreal, Canada, and his colleagues found that although road fatalities in the United States fell between 1995 and 2010, this benefit was not spread evenly across the socio-economic spectrum (S. Harper et al. Am. J. Epidemiol. 182, 606–614; 2015). If you live in the United States and have at least a university degree, your odds of dying on the nation’s roads have declined. But if you haven’t graduated from university, those odds have risen. In 1995, the mortality rates related to motor-vehicle accidents involving people at the bottom of the education spectrum were 2.4 times higher than those involving people at the top. By 2010, they were about 4.3 times higher.One reason for this might be that people with less money tend to own older vehicles that lack advanced safety features, such as rear-facing cameras, blind-spot detectors and adaptive cruise control. To put it more simply: if there is a group in the United States that stands to benefit most from the life-saving potential of self-driving technology, it’s those who live in the greatest poverty, but only if they can afford the technology. Driverless-car technology might have the potential to improve public health and save lives, but if those who most need it don’t have access, whose lives would we actually be saving?
Thursday, May 9, 2019

Notes toward a theory of the corpus, Part 1: History [#DH]
The recent discussion of Nan. Z. Da, The Computational Case against Computational Literary Studies, has me thinking about Matt Jockers' Macroanalysis, in particular, about his high-dimensional graph of his 19th century corpus. Da dissmisses with with two paragraphs (pp. 610-611). Interestingly enough, though, when Critical Inquiry hosted a discussion forum on the article, it used tan image of that graph to head the forum. That, I assume, is because it is visually compelling.
Visually compelling, but nontheless trivial? I think not. I'm bumping this post to the top of the cue. It represents my thinking about the implications of that diagram as of late September of 2018. I've thought a bit more about that diagram in the past month, going over and over and over. I've got a few more thoughts.
That graph, of course, is constructed in a space of roughly 600 dimensions. We can think of that space as, shall we say, a design space, where each point represents a possible novel. Like most such spaces, most of it is empty. What's interesting about his space is that it emerged over time and we can more or less track that emergence. That follows from the fact that the texts in that space are ordered in time, more or less, from left to right. As novels were written in the course of the century, they enlarged the space, rather than moving about in the already existing space. That's what's interesting, new texts enlarged the space. What does that tell us about the history of the novel, and about cultural evolution?
A corpus
By corpus I mean a collection of texts. The texts can be of any kind, but I am interested in literature, so I’m interested in literary texts. What can we infer from a corpus of literary texts? In particular, what can we infer about history?
By corpus I mean a collection of texts. The texts can be of any kind, but I am interested in literature, so I’m interested in literary texts. What can we infer from a corpus of literary texts? In particular, what can we infer about history?
Well, to some extent, it depends on the corpus, no? I’m interested in an answer which is fairly general in some ways, in other ways not. The best thing to do is to pick an example and go from there.
The example I have in mind is the 3300 or so 19th century Anglophone novels that Matthew Jockers examined in Macroanalysis (2013 – so long ago, but it almost seems like yesterday). Of course, Jockers has already made plenty of inferences from that corpus. Let’s just accept them all more or less at face value. I’m after something different.
I’m thinking about the nature of historical process. Jockers' final study, the one about influence, tells us something about that process, more than Jockers seems to realize. I think it tells us that cultural evolution is a force in human history, but I don’t intend to make that argument here. Rather, my purpose is to argue that Jockers has created evidence that can be brought to bear on that kind of assertion. The purpose of this post is to indicate why I believe that.
A direction in a 600 dimension space
In his final study Jockers produced the following figure (I’ve superimposed the arrow):
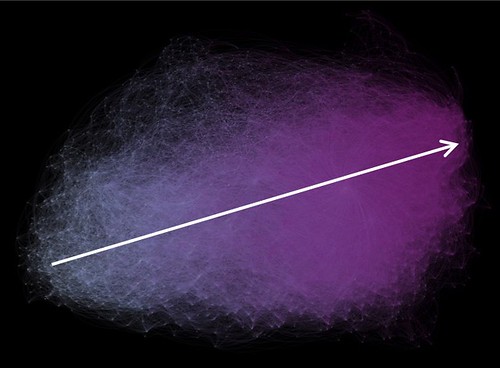
Each node in that graph represents a single novel. The image is a 2D projection of a roughly 600 dimensional space, one dimension for each of the 600 features Jockers has identified for each novel. The length of each edge is proportional to the distance between the two nodes. Jockers has eliminated all edges above a certain relatively small value (as I recall he doesn’t tell us the cut off point). Thus two nodes are connected only if they are relatively close to one another, where Jockers takes closeness to indicate that the author of the more recent novel was influenced by the author of more distant one.
You may or may not find that to be a reasonable assumption, but let’s set it aside. What interests me is the fact that the novels in this graph are in rough temporal order, from 1800 at the left (gray) to 1900 at the right (purple). Where did that order come from? There were no dates in 600D description of each novel, so the software was not reading dates and ordering the nodes according to those dates. By process of elimination, that ordering must be a product of whatever historical process that produced the texts represented in the graph. What else is there? That process must therefore have a temporal direction.
I’ve spent a fair amount of effort explicitly arguing that point [1], but don’t want to reprise that argument here. I note, however, that the argument is a geometrical one. For the purposes of this piece, assume that that argument is at least a reasonable one to make.
What is that direction? I don’t have a name for it, but that’s what the arrow in the image indicates. One might call it Progress, especially with Hegel looking over your shoulder. And I admit to a bias in favor of progress, though I have no use for the notion of some ultimate telos toward which history tends. But saying that direction is progress is a gesture without substantial intellectual content because it doesn’t engage with the terms in which that 600D space is constructed. What are those terms? Some of them are topics of the sort identified in topic analysis, e.g. American slavery, beauty and affection, dreams and thoughts, Greek and Egyptian gods, knaves rogues and asses, life history, machines and industry, misery and despair, scenes of natural beauty, and so on [3]. Others are stylistic features, such as the frequency of specific words, e.g. the, heart, would, me, lady, which are the first five words in a list Jockers has in the “Style” chapter of Macroanalysis (p. 94).
The arrow I’ve imposed on Jockers’ graph is a diagonal in the 600D space whose dimensions are defined by those features and so its direction must specified in terms that are commensurate with such features. Would I like to have an intelligible interpretation of that direction? Sure. But let’s leave that aside. We’ve got an abstract space in which we can represent the characteristics of novels (Daniel Dennett might call this a design space) and we’ve got a vector in that space, a direction.
What’s that direction about? What is it about texts that is changing as we move along that vector? I don’t know. Can I speculate? Sure. But not here and now. What’s important now is that that vector exists. We can think about it without having to know exactly what it is.
A snapshot of Spirit of the 19th century
In a post back in 2014 I suggested that Jockers’ image depicts the Geist of 19th century Anglo-American literary culture [2]. That’s what interests me, the possibility that we’re looking at a 21st century operationalization of an idea from 19th century German idealism. Here’s what the Stanford Encyclopedia of Philosophy has to say about Hegel’s conception of history [4]:
In a sense Hegel’s phenomenology is a study of phenomena (although this is not a realm he would contrast with that of noumena) and Hegel’s Phenomenology of Spirit is likewise to be regarded as a type of propaedeutic to philosophy rather than an exercise in or work of philosophy. It is meant to function as an induction or education of the reader to the standpoint of purely conceptual thought from which philosophy can be done. As such, its structure has been compared to that of a Bildungsroman (educational novel), having an abstractly conceived protagonist—the bearer of an evolving series of so-called shapes of consciousness or the inhabitant of a series of successive phenomenal worlds—whose progress and set-backs the reader follows and learns from. Or at least this is how the work sets out: in the later sections the earlier series of shapes of consciousness becomes replaced with what seem more like configurations of human social life, and the work comes to look more like an account of interlinked forms of social existence and thought within which participants in such forms of social life conceive of themselves and the world. Hegel constructs a series of such shapes that maps onto the history of western European civilization from the Greeks to his own time.
Now, I am not proposing that Jockers’ has operationalized that conception, those “so-called shapes of consciousness”, in any way that could be used to buttress or refute Hegel’s philosophy of history – which, after all, posited a final end to history. But I am suggesting that can we reasonably interpret that image as depicting a (single) historical phenomenon, perhaps even something like an animating ‘force’, albeit one requiring a thoroughly material account. Whatever it is, it is as abstract as the Hegelian Geist.
How could that be?
Wednesday, May 8, 2019

More description
The psychological sciences spend too much time on, and place too much weight on, experiments. Given our current state of knowledge we should be spending much more time on description, and debating the relative merits of different descriptions. https://t.co/c2otUweoHs— Thom Scott-Phillips (@tscottphillips) May 8, 2019
Subscribe to:
Posts (Atom)