Poets are the unacknowledged legislators of the world.
– Percy Bysshe Shelley
... it is precisely because we are talking about ordinary language that we need to adopt a notation as different from ordinary language as possible, to keep us from getting lost in confusion between the object of description and the means of description.
–Sydney Lamb
Worlds within worlds – that’s how Tim Perper, my friend and colleague, described biology. At the smallest scale we have individual molecules, with DNA being of prime importance. At the largest scale we have the earth as a whole, with all living beings interacting in a single ecosystem over billions of years. In between we have cells, tissues, and organs of various sizes, autonomous organisms, populations of organisms on various scales from the invisible to continent-spanning, and interactions among populations of organisms on various scales.
Literature too is like that, from single figures and tropes, even single words (think of Joyce’s portmanteaus) through complete works of various sizes, from haiku to oral epics, from short stories through multi-volume novels, onto whole bodies of literature circulating locally, regionally, across continents and between them, from weeks and years to centuries and millennia. Somehow we as humanists and literary critics must comprehend it all. Breathtaking, no?
In this essay I sketch a potential computational historicism operating at multiple scales, both in time and textual extent. In the first part I consider network models on three scale: 1) topic models at the macroscale, 2) Moretti’s plot networks at the mesoscale, and 3) cognitive networks, taken from computational linguistics, at the microscale. I give examples of each and conclude by sketching relationships among them. I open the second part by presenting an account of abstraction given by David Hays in the early 1970s; in this model abstract concepts are defined over stories. I then move on to Hauser and Le-Khac on 19th Century novels, Stephen Greenblatt on self and person, and consider several texts, Amleth, Hamlet, The Winter’s Tale, Wuthering Heights, and Heart of Darkness.
Graphs and Networks
To the mathematician the image below depicts a topological object called a graph. Civilians tend to call such objects networks. The nodes or vertices, as they are called, are connected by arcs or edges.

Such graphs can be used to represent many different kinds of phenomena, a road map is an obvious example, a kinship tree is another, sentence structure is a third example. The point is that such graphs are signs of phenomena, notations. They are not the phenomena itself.
Macro: Topic Modeling
Over the past decade researches in several discipline have used so-called topic models to investigate large document collections, from hundreds to tens of thousands of documents. While the concept of a topic is given a technical sense within the methodology, that sense resembles the common sense notion well enough that we need not examine the methodology in great deal.
In this view any given document is said to contain discourse on various topics, each realized by vocabulary typical of the topic. Given two documents pulled from a collection might consist of the same collection of topics, or have no topics in common. Or they might share a few, some, or many but not all topics. The general technique is to do a massive comparison among all documents in a collection so as to determine which groups of words tend to “hang together.” Such groups likely are used to talk about the same thing.
Topic modeling technique uses something called Latent Dirichlet Allocation (LDA), which treats individual texts as bags of words. What does that mean? Imagine that some document, any document — a poem by Denise Levertov, a play by Beaumarchais, a technical article by Richard Feynman, a novel by George Eliot, whatever — is printed out on single sides of paper sheets. Slice the sheets into thin strips each containing a single line of print; cut those strips into individual words like so many pieces of confetti; and gather all the individual snippets together and place them into a bag. THAT’s a bag of words.
That bag of words has lost all the structure that made those many words into a coherent text. If you were to take such a bag and organize the individual slips of paper into a coherent text, there is almost no chance that your would reproduce the original text. Whatever it is that LDA is doing, it is not “reading” texts in any meaningful sense of the word. It knows nothing about syntax, nothing about semantics, nothing about discourse, and little about spelling. All it can do at the bag level, that is, at the level of individual texts, is recognize whether or not two snippets of paper contain the same set of characters (that is, a word) and count the number of snippets containing a given word. That’s all that is relevant for basic topic modeling, the list of words in each document and the number of times each word occurs in the document.
Topic modeling does assume, however, that the processes that produced each individual text were not random. On the contrary, those structures are highly structured and complex. Thus the pile of words in each bag is NOT a random collection of words despite the fact that their serial order in the text has been lost.
But LDA doesn’t work with individual bags taken in isolation. It works with the whole collection, comparing the contents of all the bags to see which groups of words consistently occur together in many different bags. Those sets are co-occurring words are topics in the technical sense given by LDA. Just how LDA does this is not of immediate concern (the statistics are quite sophisticated); we have to trust that the people who created and developed the technique know what they’re doing.
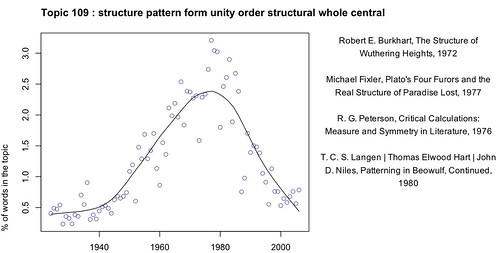
With that in mind, let’s consider a particular example that’s received a lot of attention the literary blogosphere, Andrew Goldstone and Ted Underwood, What Can Topic Models of PMLA Teach Us About the History of Literary Scholarship? (Journal of Digital Humanities, Vol. 2, No. 1 Winter 2012). As their title suggest, Goldstone and Underwood examined the entire collection of articles in PMLA, some 5000 texts spanning over a century of scholarship.
The figure below depicts on of the topics identified in the model that Underwood developed. Topic 109 – a number assigned by the software – consists of a particular group of words, some of which are listed at the top of the figure. These are words that consistently occurred together in the collective; individual words may of course also be associated with different topics. The graph depicts the occurrence of topics over topic, with this particular topic peaking in the late 1970s. Several articles containing this topic are listed at the right (the Peterson is a particular favorite of mine).
The entire model can be depicted as a graph, with reservations we’ll get to shortly. The following graph represents Goldstone’s overall model:
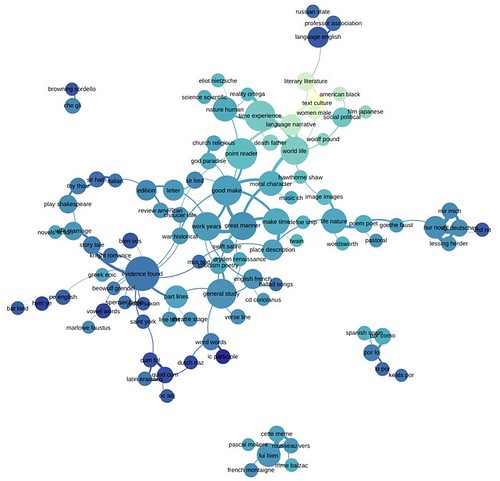
We’re told:
The size of each node (roughly) indicates the number of words in the topic; color indicates the average date of words. (Blue topics are older; yellow topics are more recent.) Topics are linked to each other if they tend to appear in the same articles. Topics have been labeled with their most salient word — unless that word was already taken for another topic, or seemed misleading...The structure of the network makes a loose kind of sense. Topics in French and German form separate networks floating free of the main English structure. Recent topics tend to cluster at the bottom of the page. And at the bottom, historical and pedagogical topics tend to be on the left, while formal, phenomenological, and aesthetic categories tend to be on the right.
There you have it, over a century’s worth of literary thinking by thousands of scholars depicted in one diagram. Of course there are limitation; there are always limitations:
But while it’s a little eerie to see patterns like this emerge automatically, we don’t advise readers to take the network structure too seriously. A topic model isn’t a network, and mapping one onto a network can be misleading. For instance, topics that are physically distant from each other in this visualization are not necessarily unrelated. Connections below a certain threshold go unrepresented.
No doubt there are things we could do, but always compromises must be made. As Goldstone and Underwood caution, a topic model isn’t a network, but we CAN use a network to represent one if we’re careful and keep in mind the limitations,
Now let’s look at a kind of network that’s been developed to represent single texts.
Meso: Moretti, Plots and Networks
Franco Moretti has been using topological graphs in his investigations of plot, Network Theory, Plot Analysis. These networks are not generated automatically by the computer. Moretti sketches them by hand and then uses a computer to make neat diagrams.
Here’s his network for Hamlet:
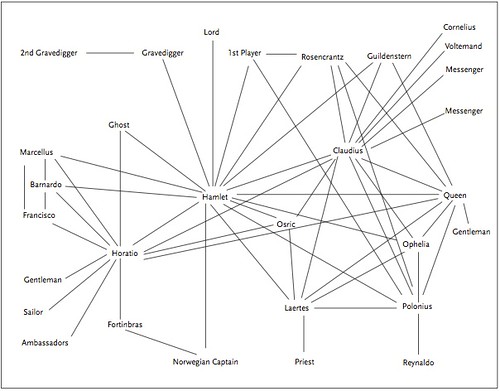
The nodes represent characters in the play. If two characters speak anywhere in the play, no matter how many or how few words pass between them, they’re connected by an edge. The obvious lesson of this diagram is the some characters are more highly connected than others. Each character has its space. Remove Hamlet, Moretti notes, and the network all but falls apart: “between the court on the right, and the region that includes the Ghost and Fortinbras on the left all that remains are the three edges linking Horatio to Claudius, Gertrude, and Osric: a few dozen words”. Remove Claudius, who is also richly connected with other character, and “what happens is that a handful of peripheral characters are affected, but the network as a whole not much” (p. 4).
In discussing these networks Moretti makes three general points. 1) On the one hand all of the language is stripped away and so is the nature of the interactions the characters have with one another. The diagram is thus “distant” from the text/play. 2) At the same time it depicts, in a single image one can inspect at one’s leisure, something obviously central to the action, namely, who relates to whom. And, I would add, the process of creating the graph requires the researcher to look very carefully indeed at the text. 3) Finally, a point I’ll return to a bit later, the diagram “spatializes” time. These relationships are revealed to us in time, starting with that between Hamlet and the ghost; but the diagram places them all before us in space.
Moretti has investigated plays other than Hamlet, and texts other than Shakespeare plays. But one can see practical limitations for doing this by hand on single sheets of paper. War and Peace, anyone?
Micro: Cognitive Networks
Finally, let’s turn to networks more or less at the micro scale: semantic or cognitive networks. These networks have been explored by researchers in computational linguistics and artificial intelligence starting back in the late 1960s and continuing to the present day. The general idea is that concepts are represented by nodes while relations between concepts are represented by edges between the nodes. In this view, which descends from associationist psychology dating back to Locke, the mind consists of a vast network of concepts forming the background ideation guiding our passage through the world, including conversation and writing.
When one speaks or writes one takes a path through the network and renders the appropriate concepts into language by using the appropriate words:
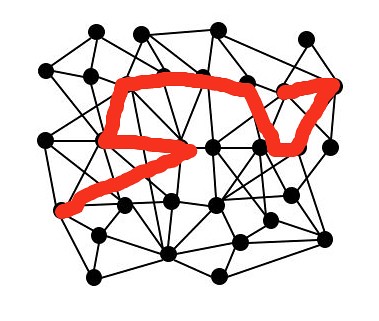
Conversely, when one listens or reads, the chain of signifiers prompts one to generate a path through the network, “activating” concepts one after the other.
I want to consider some networks designed by Brian Phillips who, like me, studied with the late David Hays at the State University of New York at Buffalo back in the middle 1970s. For the purposes of this essay these networks are representative of a large class of models devised by researchers spanning the globe over the course of decades. All of these diagrams are from Brian Phillips, "A Model for Knowledge and Its Application to Discourse Analysis," American Journal of Computational Linguistics, Microfiche 82, 1979.
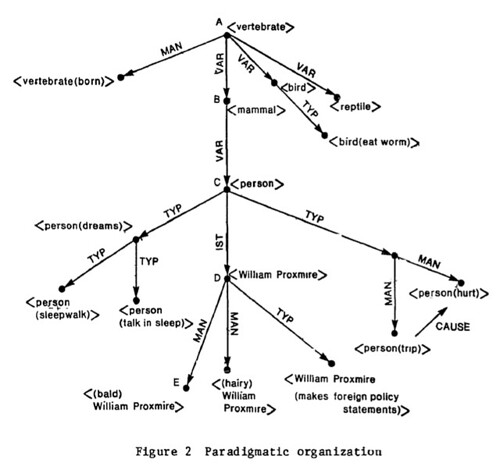
The following diagram is a fragment of what the structural linguists called paradigmatic structure, the plane of selection in Jakobson’s phrase. At the top of the tree ¬– for this network fragment has a restricted from know as a tree, for obvious reasons (the root is at the top, branches and leaves below) – we have a node for the generic vertebrate. At the very bottom we have nodes for specific individuals. In between we have nodes for mammals, birds, and reptiles, where person is a variety of mammal. Notice that the edges are labeled: MAN (manifestation), VAR (variety), and TYP (typical). Explaining the significance of those labels is straightforward, but tedious and irrelevant for our present purposes. The point is simply that each edge IS labeled according to the nature of the relationship between the connected nodes. The arrow at one end specifies the direction of the relationship; a bird is variety (VAR) of vertebrate, but vice versa. Much of the discussion in the literature is about what kids of edges one needs.
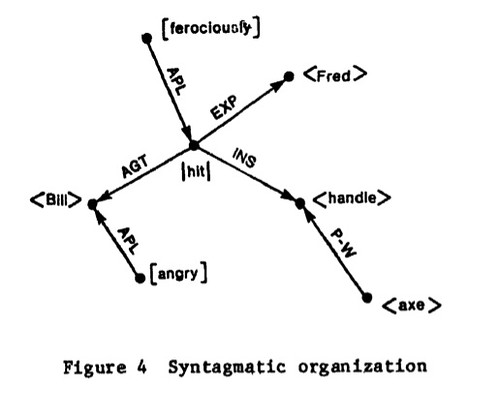
The next diagram depicts a bit of syntagmatic structure, the plane of combination. Bill, down there at the lower left, would be linked to person, then mammal, then vertebrate, and then to animal, through paradigmatic edges. He is linked to an event, hit, through an AGT (agent) edge. Other syntagmatic edges: APPL (apply), EXP (experiencer), INS (instrument) and P-W (part-whole) Events are one kind of node; entities, such as Bill, are a different kind of node. Syntagmatic edges connect nodes of different kinds. And that, the kinds of nodes necessary, has also generated a large literature.
The previous two diagrams depict fragments of systemic structure. Think of them as roughly like a dictionary. Now we come to episodic structure, which is a cross between an encyclopedia and a historical record. Each square node (regardless of color) in the following diagram represents a single episode:

Episodes are localized in time and space. Notice that some episodes are parts (P-W) of others. Other nodes are said to represent an event which causes (CAUSE) some other later event.
Phillips was interested in stories in which people drowned. The above network represents one set of events involved in drownings, capsizing. Roughly, the diagram represents, from left to right: a boat overturns, causing its occupant, Horatio Smith (at the bottom) to be injured; and that in turn causes Smith to drown (upper right).
What about the difference between the episodes represented by black nodes and those represented by white nodes? The network as a whole represented drowning by capsizing. If one is told, or reads, reads only the Horatio Smith (episodes at the left) and that he drowned (episode at the right) one can nevertheless infer the rest because it is part of one’s knowledge of drowning.
The general point is simple: cognitive networks are complex and very large. The diagrams above depict only fragments of the network Phillips had to model. All of those structures are connected together in the computer’s inner workins.
Such models have many kinds of nodes, many kinds of relations between the nodes, and large networks constructed of them. These models are huge. A network adequate for represented the background knowledge implied by a Shakespeare would be enormous and, so far as I know, would require constructions we don’t know how to build. But we do know something of such beasts, enough for me to sketch out how these huge networks of microscale entities are related to Moretti’s mesoscale plot nets and the topic modelers’ macroscale historical nets.
Networks of Nets: Cognets, Plots, Topics
Let us start with Moretti. His diagrams depict only characters and the fact that characters speak to one another. Some of those characters are kin of various kinds and two of them, Hamlet and Ophelia, are prospective kin by marriage, at least at the beginning of the play. Others are not kin, but are linked by various relations of fealty, whether noble or peasant. All of that can be represented in network form, using the appropriate kind of nodes and edges, and would be a crucial part of the vast network of background knowledge on which the play depends. That network would also contain knowledge about the rights and duties associated with those various positions in the social world.
One bit of such knowledge is that a son is expected to avenge his father’s death. Another bit of knowledge is that one respects one’s kin, which implies that one does not do them violence, much less murder. Those two bits of knowledge cause Hamlet some problems. His literary predecessor, Amleth of Saxo-Grammaticus, dealt with the problem by feigning madness and managed to achieve a happy outcome. Shakespeare’s Hamlet was not so lucky; his madness was perhaps real.
The required background knowledge ¬– more or less the Elizabethan worldview ¬– would also indicate that, for example, people drown in water, but flowers float, that courtiers behind curtains are invisible, that swords kill, that the flesh rots away from dead bodies, assisted by words, leaving a pile of bleached bones, including the skull, and so forth. One could play a Borgesian game imagining the various network structures implied by this play. How should one grasp a skull so as to support it? What colors the flowers? The fabric of the curtain? How long the sword? And the shape of the hilt? And ghosts?
Now, to Moretti’s network. He’s compressed time into space. Let’s unfold it. Let us imagine the vast cognitive network that is implied by Shakespeare’s text. Moretti’s network is there, above the stage, constructed of small lights connected by narrow neon tubes.
You’re seated in the theatre. The play begins. You see a soldier, Francisco, and an officer, Bernardo. That’s two characters added to the net: two lights go on. They converse; one of tubes starts to glow. Then a nobleman enters, Horatio, along with another officer, Marcellus. Two more characters added to the net; two lights go on. The four of them converse; more edges begin to glow. One of them (Francisco) leaves; a light goes dim and the appropriate edges go black.
And so it goes through the entire play. The lights and tubes representing Moretti’s network go on and off as the play unfolds. When a character leaves the stage, a light dims, along with the edges connected to other characters on the stage. When a character returns to the stage, the light glows, and so forth.
One could imagine this display as a computer generated animation. If you think about it a bit, however, you’ll see that it would be easy enough, if a bit tedious, to hack something together in presentation program, such as the ubiquitous MS Powerpoint. Let each slide represent one state of, shall we call it, the Moretti net for Hamlet. The slide background is black while the network is dark gray in state 0:
- State 0: empty stage. Network dim.
- State 1: Francisco and Bernardo enter and talk. Their nodes are set to white, as is the edge connecting them.
- State 2: Horatio and Marcellus enter and converse. More nodes and edges set to white.
- State 3: Francisco leaves. His node is set back to gray along with the corresponding edges.
- State 4: ....
We could also print out each slide and pin them to a board, like storyboard ¬¬– which it is of course, though rather more abstract that then ones movie people use to plan their films.
Would such a displays be useful? How can we know until it is done? And perhaps the use and insight will only emerge when we create such animated displays for a dozen plays and then compare them.
My object is not so much to suggest that Moretti’s literary lab should actually do this ¬– though I would love to see such visualizations ¬– as to give a sense of how Moretti’s static diagrams are related to the process of activation spreading through a cognitive network. Each node in a Moretti net is implicitly linked to a subnetwork of information about that character. Each edge between such nodes (character) implicitly represents the large cognitive nets implied by the words exchanged by those characters. A Moretti network can thus be conceived as a very compressed representation of the play, an abstract.
[For extra credit, use the current Arden Hamlet and do net simulations for all three versions, First and Second Quarto, and First Folio. Compare.]
And so we can begin to think about the microscale structures of cognition and the mesoscale structures of a Shakespeare play. What about the relations between microscale cognitive nets and the macroscale of topic analysis over thousands of documents spanning a century or more of time?
As I indicated above, topic analysis assumes that language is organized in intricate and fairly “rigid” ways. Cognitive networks are a way for representing the structure on which topic analysis depends. As I’ve indicated above, any given text can be thought of as a path through a network. A Moretti network is an abstract of a single text. But topic models do not consider single texts. Still, each text in the examined corpus can be thought of as a path through a semantic network. Each topic corresponds to a subnetwork and the text given over to that topic is a path through the corresponding subnetwork.
The prima facie validity of the procedure depends on the fact that a large portion to the topic-sets it identifies seem coherent. That is to say, many topics in the technical sense can be identified with topics in the ordinary sense.
In that ordinary sense, drowning is a topic. There’s a bunch of words likely to be used in speaking or writing that topic: boat, ship, skiff, river, lake, sea, crash, swamp, sink, sailor, passenger, shark, and so on. If some document collection has lots of stories of drownings, one would expect some of these words to show up in each such document. Of course, each of these words could be a token of other topics – sink with plumbing, ship with UPS, crash with studying for exams, and so forth – but a couple of paragraphs about repairing the kitchen sink are not likely to also talk about UPS route men and sinking ships, though a given exam might be a “sink or swim” situation for some poor student.
Now, what of the fact that a document collection implies thousands, hundreds of thousands, and even millions of individual minds, all reading documents from the collection. In order for these people to communicate effectively, though, their cognitive nets on a given topic must be highly, though not completely, alike. As long as we don’t take it too literally, we can think of a topic model as representing a group mind evolving over a period of time. At some point we no doubt will want to jettison this fiction, but it will hold us for now.
Where Are We?
Of the three types of network models we’ve considered, the cognitive network is the oldest. In a way, it’s also the most problematic. Though quite a bit of work has been done on such models, more in the 1970s and 1980s than now, no one can reasonably claim to have modeled a human mind, nor even a significant fraction of one. Yet, such models have made the mind thinkable in a way it wasn’t before. And that’s all we need to suggest a foundation for both topic models and Moretti nets. In the second part of this essay I’ll push the cognitive model one more step and show how it can support a reconceptualization of literary history, one that has promise of redeeming Shelley’s assertion the poets are the unacknowledged legislators of the world.
* * * * *
Addendum: A cognet is, in principle, a simulation of a mental process. A topic net is not, not a simulation of either an individual or a group “mind.” It is a picture of, a snapshot, a pile of “data.” A Moretti net, especially one that’s been “animated” to visualize states of the unvolding action, well, it’s a bit of one or the other, no?
No comments:
Post a Comment